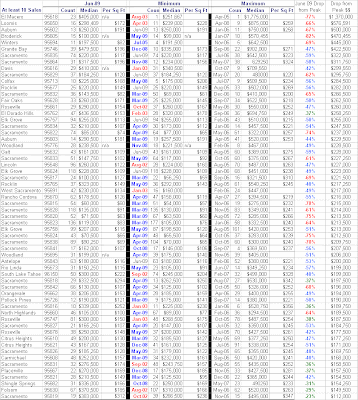
Below is a table (apologies for so much data in such a small font), with a comparison by zip code, starting with the June 2009 median price (as well as count of transactions and price per sq ft), compared to the minimum and maximum prices since August 2002 (data doesn't go back any further).
In the minimum field, a red date indicates the median price minimum was before the bubble burst, a blue date indicates a median price minimum was hit after the bubble burst. No color indicates that the most recent month was the minimum.
The percent drop from peak (maximum) is also color coded for the severity of the drop (red most severe, green least). Zip codes are sorted from the greatest dollar drop from peak to the least.
Update: I calculated the weighted median price (for the June 2009 data) and it comes out to be $211,628. The weighted median per sq foot is $125....this implies a median home size of 1,687 square feet. Which given 3x income, is affordable to a houshold making $70,550 a year. (Statistical note...you can't just average all the zip codes, you have to weight the data by the number of sales in each zip code to get an accurate picture.)
Note: Data has been filtered for zip codes with at least 10 transactions in June 2009.


6 comments:
Thanks for sharing. This is very informational.
So great Wise One ... does this mean that the green zips will catch up with the other zips? Or, does it mean that the green zips were so expensive to start with (in relative terms), there wasn't as much speculative frenzy and thus, less decline from the peak? I guess it could mean that more people are moving from North Highlands to El Dorado Hills, but I kinda doubt that.
Actually, I recall the decline in 1990 and at least as for EDH and Shingle Springs, prices didn't decline (peak to trough) with the same level of intensity that they did in areas of Sacramento.
Location, location, location.
Thanks for all the hard work!
Great data, thanks. I noticed that in some zip codes as Granite Bay the price/sqf has gone up this year. Are the prices recovering in some areas, or is this a effect of change in mix (lot size, age, finishing, amenities, etc)?
Regarding the green zips, my thought is to look more at the total $$ drop (hence I sorted on that). I noticed on housing tracker that the 25th, 50th and 75th percentile tend to drop at different percentages but by approximately the same dollar amount. i.e. 200k is 1/2 of 400k, but only 1/3 of 600k...even though it is the same $$. People budget with $$ not %.
Regarding Granite Bay - Hard to say, the low was in Dec of 08 for price (not sure about sq ft). I am sure mix has something to do with it. But at the same time, there are a lot of other zips who have now hit their low (not to say another one couldn't be in the future). I would look at rent parity, since the pricing data is all over the place, and NODs to see how much price pressure there will be in the future.
BT- What does it mean if the minimum was before the bubble burst? I'm not sure how to interpret that piece of the chart.
As a sidenote, for the first time in a few years zillow emailed me to say that my house had gone up .5% in the last month a few days ago. At that rate only 6 more years to get back to where we started. Ha.
Tia - By my interpretation, it could mean two things, prices are still a little frothy, or the mix of homes in a neighborhood has changed (higher end homes built since Aug 2002), or a combination of both.
Glad to hear Zillow is finally bringing good tidings.
Post a Comment